MCP414X/416X/424X/426X
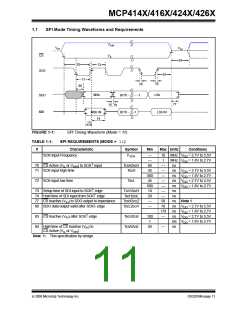
2.0
TYPICAL PERFORMANCE CURVES
Note:
The graphs and tables provided following this note are a statistical summary based on a limited number of
samples and are provided for informational purposes only. The performance characteristics listed herein
are not tested or guaranteed. In some graphs or tables, the data presented may be outside the specified
operating range (e.g., outside specified power supply range) and therefore outside the warranted range.
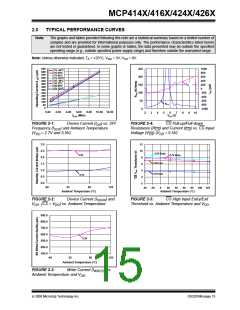
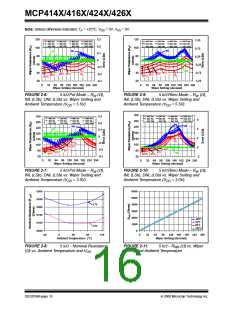
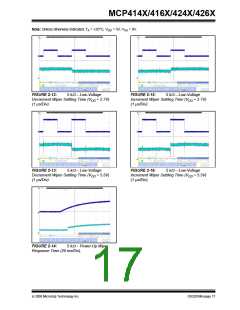
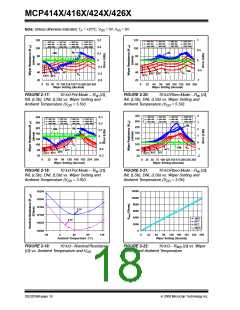
Note: Unless otherwise indicated, TA = +25°C, VDD = 5V, VSS = 0V.
650
600
250
200
150
100
50
1000
800
600
400
200
0
2.7V -40°C
2.7V 25°C
550
500
450
400
350
300
250
200
150
100
50
2.7V 85°C
2.7V 125°C
5.5V -40°C
5.5V 25°C
5.5V 85°C
5.5V 125°C
ICS
-200
-400
-600
-800
-1000
RCS
0
0
0.00
2.00
4.00
6.00
fSCK (MHz)
8.00 10.00 12.00
2
3
4
5
6
7
8
9
10
VCS (V)
FIGURE 2-1:
Frequency (f
Device Current (I ) vs. SPI
) and Ambient Temperature
FIGURE 2-4:
Resistance (R ) and Current (I ) vs. CS Input
CS Pull-up/Pull-down
DD
SCK
CS
CS
(V = 2.7V and 5.5V).
Voltage (V ) (V = 5.5V).
DD
CS DD
3.0
2.5
2.0
1.5
1.0
0.5
0.0
12
10
8
5.5V Entry
5.5V Exit
5.5V
2.7V Entry
6
4
2.7V Exit
2.7V
2
0
-40
25
85
125
-40 -20
0
20
40
60
80
100 120
Ambient Temperature (°C)
Ambient Temperature (°C)
FIGURE 2-2:
Device Current (I
) and
FIGURE 2-5:
CS High Input Entry/Exit
SHDN
V
. (CS = V ) vs. Ambient Temperature.
Threshold vs. Ambient Temperature and V
.
DD
DD
DD
900.0
800.0
700.0
600.0
5.5V
500.0
400.0
300.0
-40
25
85
125
Ambient Temperature (°C)
FIGURE 2-3:
Write Current (I
) vs.
WRITE
Ambient Temperature and V
.
DD
© 2008 Microchip Technology Inc.
DS22059B-page 15

 MICROCHIP [ MICROCHIP ]